
Fertilizer NPK
283
04/11/2025

1.Product Characteristics and Properties
1.1 Definition and Classification
NPK fertilizer refers to fertilizers containing at least two or all three of the primary nutrients: nitrogen(N), phosphorus(P), and potassium (K). According to the international fertilizer association (IFA) and Food and Agriculture Organization(FAO) standards, NPK fertilizers are classified into three categories based on production processes:
- Chemical Compound Fertilizer: produced through chemical reactions, featuring excellent nutrient integration, uniform element distribution, and long-lasting effects
- Compound Mixed Fertilizer: produced by physical mixing methods, forming granules by blending different nutrient materials. According to international standards, total nutrient content typically ranges from 30% to 50%
- Bulk Blending Fertilizer(BB Fertilizer): Mechanical mixing of single-element fertilizers in specific proportions, with each fertilizer particle maintaining its original form.
1.2 Nutrient Labeling and Content Specifications
NPK fertilizers are typically labeled with three numbers representing the percentage of P₂O₅-K₂O content:
- Common specifications include: 15-15-15, 17-17-17, 18-18-18, 16-16-16, and 24-12-6
- According to international standards, high-quality compound fertilizers generally have a total nutrient (N+P₂O₅+K₂O) content of no less than 40%
- High-concentration compound fertilizers popular in the European market can reach total nutrient contents of 45%-60%
- Special formulations can be adjusted according to crop requirements, such as 5-10-30 for fruit crops or 20-10-10 for leafy vegetables
1.3 Physical and Chemical Properties
- Physical Properties
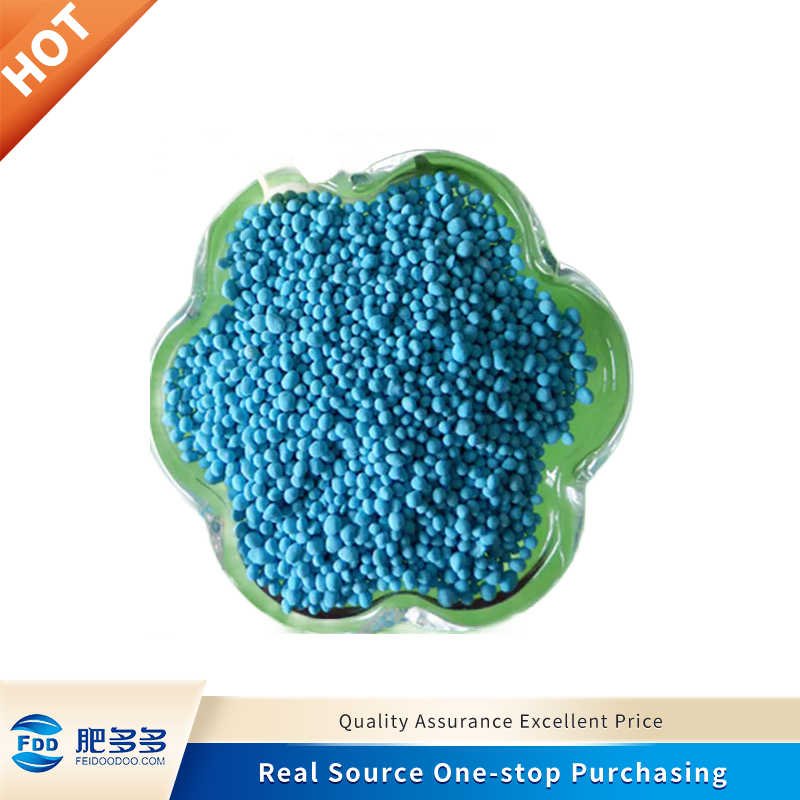
- Granular Characteristics: high-quality NPK fertilizers feature round or near-round granules with uniform particle size(2-4mm) and smooth surfaces.
- Strength: International standard crushing strength ≥ 20N/granule, facilitating mechanical application and transportation.
- Critical Relative Humidity(CRH): high-quality compound fertilizers have CRH values > 70%, ensuring storage stability.
- Bulk Density: Typically 0.95-1.05g/cm³, affecting packaging and transportation efficiency
- Flowability: flow angle typically 25°-35°, conducive to uniform spreading
-
- Chemical Properties:
- Water solubility: in quality compound fertilizers, 70%-90% of nutrients are water-soluble, facilitating crop absorption
- pH value: varies significantly between different formulations(4.5-8.5), affecting soil environment and nutrient availability
- Salt index: affects crop water absorption, typically controlled between 60-70
- Nutrient Release characteristics: depending on product type, can achieve quick-release (24-72 hours), slow-release (2-4 weeks), or controlled-release (2-9 months) effects.
-
1.4 Comparative Analysis of differernt NPK fertilizers
| Type | Production Process | Nutrient Uniformity | Fertilizer Effect | Nutrient Release Rate(28 days) | Application Range |
| Chemical Compound | Chemical reaction | Excellent (>95%) | long-lasting,balanced release | 60-70% | Economic crops, high-value crops |
| Compound Mixed | Physical mixing and granulation | Good (85-95%) | relatively balanced nutrient release | 70-80% | Multiple crops, extensive applications |
| Bulk Blending(BB) | Mechanical Mixing | Fair (75-85%) | Each nutrient maintains original characteristics | Varies by component | regional customization needs |
| Controlled-release NPK | Coating technology | Very good (90-98%) | Long-term slow release | 30-50% | economic crops, facility agriculture |
| Water-soluble NPK | Crystallization or spray drying | Excellent (>98%) | rapid dissolution and absorption | >90% | drip irrigation, foliar application |
2.Production Processes and Manufacturing Methods
2.1 Main Raw Materials
Raw materials for NPK fertilizer production include:
- Nitrogen Sources:
- Urea (CO(NH₂)₂): 46.4% nitrogen content, global production approximately 170 million tons/year
- Ammonium Sulfate ((NH₄)₂SO₄): 21% nitrogen, 24% sulfur
- Ammonium Nitrate (NH₄NO₃): 35% nitrogen, half as nitrate and half as ammonium
- Calcium Nitrate (Ca(NO₃)₂): 15.5% nitrogen, 19% calcium, suitable for vegetables and fruit trees
-
- Phosphorus Sources:
- Monoammonium Phosphate (NH₄H₂PO₄): 11% N, 48-61% P₂O₅
- Diammonium Phosphate ((NH₄)₂HPO₄): 18% N, 46% P₂O₅
- Single Superphosphate (Ca(H₂PO₄)₂·H₂O+CaSO₄): 16-20% P₂O₅
- Triple Superphosphate (Ca(H₂PO₄)₂·H₂O): 46-52% P₂O₅
-
- Potassium Sources:
- Potassium Chloride (KCl): 60-62% K₂O, global production approximately 40 million tons/year
- Potassium Sulfate (K₂SO₄): 50-52% K₂O, 18% sulfur, suitable for chloride-sensitive crops
- Potassium Nitrate (KNO₃): 13% N, 45% K₂O, suitable for high-value economic crops
-
- Other Additives
- Micronutrients: Boron (0.02-1%), Zinc (0.1-2%), Copper (0.05-1%), Iron (0.1-2%), Manganese (0.1-1%), etc.
- Auxiliary Materials: Binders (0.5-2%), Anti-caking agents (0.2-1%), Colorants (0.1-0.5%), etc.
- Functional Additives: Nitrification inhibitors (0.1-0.5%), Urease inhibitors (0.05-0.3%), etc.
-
2.2 Ammonium-Acid Process(Tower Granulation)
The ammonium-acid process is the mainstream technology for high-concentration NPK production globally, accounting for about 40% of global compound fertilizer production:
- Raw Material Preparation and Proportioning:
- Molar ratio of liquid ammonia to sulfuric and phosphoric acids controlled at 1:0.9-0.95
- Solution pH controlled at 4.5-6.0; excessive acidity causes equipment corrosion, while insufficient acidity affects product quality
-
- Neutralization Reaction:
- Reaction equation: 2NH₃ + H₂SO₄ → (NH₄)₂SO₄ + heat (1619kJ/kg)
- Reaction temperature controlled at 110-130℃ through precise control of feed rate and proportions
- Neutralization heat (approximately 1000-1200kJ/kg product) used for water evaporation
-
- Potassium salt addition and granulation:
- Tower spraying pressure at 0.8-1.2MPa, atomization particle size controlled at 80-120μm
- Counter-current hot air temperature at 90-110℃, air velocity 15-25m/s
- Finished product exit temperature controlled at 80-90℃, moistureScreening and post-treatment:
- Screening precision > 96%, qualified particle size 2-4mm, proportion > 90%
- Coating agent usage 0.2-0.5kg/ton, common coating agents include mineral oil and mineral wax
Energy Consumption and Output Ratio- Average energy consumption: stream 200-300kg/ton product, electricity 40-60kWh/ton
- Water resource utilization: 0.1-0.3 tons/ton product
- Large-scale plant production capacity can reach 300,000-500,000 tons/year
2.3 Drum Granulation Process
Drum granulation accounts for approximately 25-30% of global compound fertilizer production:
-
- Raw Material Pretreatment:
- Crushing fineness: 80% passing through 60-mesh screen, increased surface area facilitates reaction
- Mixing uniformity detection: Coefficient of variation(CV) controlled atGranulation Process Control:
- Drum length-to-diameter ratio typically 3:1 to 4:1, rotation speed 8-12rpm
- Internal temperature controlled at 65-85℃, humidity 15-25%
- Residence time 4-8 minutes, bed thickness controlled at 30-40cm
Drying and Screening System:- Drying temperature controlled at 100-120℃, hot air velocity 1.2-2.5m/s
- Water evaporation rate 25-35kg/m²·h, energy utilization efficiency 65-75%
- Screening efficiency>92%, particle size compliance rate >85%
Product Stability Control:- Finished product dust contentCoating uniformity testing: water solubility test, 24-hour dissolution rate difference
2.4 Slurry Process
The slurry process is widely applied in large-scale production facilities, especially in North America and Europe:- Slurry Prepartation and Regulation:
- Slurry concentration controlled at 45-55%, viscosity 800-1200mPa·s
- Precise control of calcium-magnesium ratio (Slurry pH stabilized at 5.0-6.5, ensuring stable existence of various nutrientsPrecise Granulation Control:
- Spraying pressure 1.0-1.5MPa, atomization particle size controlled at 60-100μm
- Granulation disc diameter 2.0-3.0m, inclination angle 45-55°, rotation speed 15-25rpm
- Bed temperature controlled at 80-95℃, humidity 18-22%
Thermal Energy Management System:- Hot air temperature gradient control: inlet 350-420℃, outlet 90-110℃
- Heat recovery rate > 65%, reducing production costs
- Waste gas treatment efficiency > 99%, dust emissionFinished Product Parameter Precision Control:
- Product particle size distribution: 2-4mm proportion > 92%
- Crushing strength mean value > 35N/granule, ensuring stability during long-distance transportation
- Critical Humidity absorption(CRH) > 75%, improving storage stability
2.5 Controlled-Release NPK Fertilizer Production Process
Controlled-release NPK fertilizer technology is rapidly developing, with a stable global market growth rate of 4.5-5.5%:- Core Technical Parameters:
- Coating thickness precisely controlled at 20-200μm, errorMulti-layer coating technology(2-5 layers), achieving multi-stage nutrient releaseRelease cycle precisely designed for 40,60,90 or 180 daysCommon Coating Material Performance:
- Sulfur coating: low cost, thickness 30-100μm, suitable for short-term controlled release(1-2 months)
- Polymer coating: Thickness 15-30μm, precise release control, period 3-9 months
- Composite coating: Combines advantages of sulfur and polymer, more balanced release, longer service life
Coating Process Key Parameters:- Sulfur Coating temperature controlled at 130-150℃, polymer coating temperature 60-90℃
- Drum angle 30-40°, rotation speed 15-25rpm, ensuring uniform coating
- Cooling rate controlled at 5-8℃/min, preventing coating cracks
Release Performance Testing Standards:- 5℃ water release test: 7-day release rate 15-25%, 28-day release rate 30-50%
- Cyclic temperature test (5-35℃): Temperature sensitivity coefficientSoil incubation test: 90-day release curve deviation from theoretical design
3.Application Effects and Methods
3.1 Application Effects on Major Crops
Global data on NPK compound fertilizer application effects:- Cereal Crops:
- Wheat: scientific application of NPK compound fertilizer can increase yield by 10%-15% protein content by 0.5-1.5 percentage points
- Rice: Precise application increases yield by 10-20% compound to traditional fertilization, nitrogen utilization efficiency improved by 8-15 percentage points
- Corn: Formula application can increase yield by 15-25%, nitrogen utilization efficiency improved from 30-35% tp 40-45%
- Seasonal nitrogen utilization rate comparison for cereal crops: ordinary nitrogen fertilizer 35-40%, controlled-release compound fertilizer 45-55%
-
- Economic Crops:
- Cotton: proper application can increase yield by 15-20%, fiber length by 1.5-3.0mm
- Rapeseed: Yield increase by 15-25%, oil content improved by 1-2 percentage points
- Sugarcane: using controlled-release compound fertilizer increases yield by 2.50-8.20%
- Tobacco: Quality-type compound fertilizer can improve the sugar-to-alkaloid ratio by 15-25%, grade rate by 8-12 percentage points
-
- Fruits and Vegetables:
- Vegetables: Can increase yield by 20-30%, vitamin C content by 10-18%, reduce nitrate content by 15-25%
- Fruit trees: improve fruit quality, soluble solids content increased by 0.5-1.5°Brix, fruit size increased by 5-12%
- Greenhouse vegetables: water-soluble compound fertilizer applied through drip irrigation saves water by 30-50%, fertilizer by 20-30%
-
3.2 Scientific Application Methods and Dosages
Soil Test-Based Application Standards- Available soil nitrogenAvailable soil phosphorusAvailable soil potassiumAcidic soil (pHRecommended Application Rates for Major Crops(kg/ha):
Crop Low Fertility Soil Medium Fertility Soil High Fertility Soil Split Application Recommendation Wheat 500-600 400-500 300-400 Base fertilizer 70%, jointing stage 30% Rice 600-750 450-600 300-450 Base fertilizer 60%, tillering stage 30%, ear stage 10% Corn 600-750 450-600 300-450 Base fertilizer 50%, jointing stage 30%, tasseling stage 20% Potato 750-900 600-750 450-600 Base fertilizer 40%, tuber formation stage 60% Vegetables 900-1200 750-900 600-750 Base fertilizer 30%, growth period divided into 3-4 top dressings Fruit Trees 750-900 600-750 450-600 Pre-flowering 30%, young fruit stage 40%, fruit enlargement stage 30% - Application Depth and Position Guidelines:
- Base Fertilizer: Generally 10-15cm soil layer, sandy soil 5-10cm, clay soil 15-20cm
- Hole Application: 5-10cm from seed or plant, depth 8-12cm
- Band application: width 5-8cm, depth 8-15cm, distance from crop row 8-15cm
-
3.3 New Fertilization Technologies and Precision Fertilization
Advanced fertilization methods in modern agriculture- Fertigation Technology:
- Drip irrigation system fertilizer utilization rate can reach 70-90%, 20-30 percentage points higher than traditional fertilization
- Water-soluble compound fertilizer dissolution rate > 99.5%, EC value controlled at 1.0-2.0mS/cm
- Nutrient concentration gradient changes: Growth period 0.5-1.0g/L, fruiting period 1.0-1.5g/L
-
- Side-deep Fertilization Technology:
- Suitable for crops with row spacing >40cm, fertilizer band 10-15cm from crops
- Enhancement effect: Nitrogen utilization rate improved by 8-15 percentage points, reduced surface runoff losses
-
- Seed-Fertilizer Simultaneous Application Technology:
- Fertilizer-speed distance controlled at 3-5cm, preventing high-concentration fertilizer damage to seeds
- Integrated seeding and fertilization can improve operation efficiency by 30-50%, reduce labor intensity
-
- Variable-Rate Fertilization Technology:
- Based on soil nutrient maps and yield targets, achieving precise variable-rate fertilization
- GPS positioning accuracyField trials demonstrate fertilizer savings of 10-20% and nutrient loss reduction of 15-25%
 High Quality Compound Fertilizer NPK 12-12-17+2MGOUS$ 420 /MTMOQ: 1MTProduct Model: NPK-09Supplier ProfileNingbo Feidoodoo E-Commerce Co., LtdEstablished: October 10, 2019Company Size: 500Get Best Price
4.Market Status and Development Trends
4.1 Global Market size and Regional Distribution
- Regional Characteristics:
- Europe: Dominated by high-concentration, specialized products, environmentally friendly compound fertilizers accounting for >35%
- North America: Mainly BB fertilizers, developed customized services, widespread application of precision fertilization technology
- Asia-Pacific: Largest production and sales volume, multiple technologies coexist, high price sensitivity
- Latin America: Mainly large farm applications, aerial fertilization accounts for up to 30%
- Africa: Mainly low-concentration products, great market growth potential
-
4.2 Product Structure Change Trends
NPK Compound fertilizer product structure is undergoing significant changes- Nutrient Concentration Changes:
- Global NPK compound fertilizer average total nutrient content: 36% in 2000, 41% in 2010, 45% in 2020, with a clear upward trend
- High-concentration products (total nutrients > 50%) market share has increased from 12% in 2010 to 23% in 2022
-
- Functional Product Proportion:
- Controlled/slow-release compound fertilizer proportion: 6% in 2010, 14% in 2022, expected to reach 22% by 2030
- Water-soluble compound fertilizer proportion: 4% in 2010, 10% in 2022, expected to reach 18% by 2030
- Compound fertilizer containing micronutrients proportion: 15% in 2010, 28% in 2022, expected to reach 35% by 2030
-
- Formula Diversification:
- Specialized fertilizer proportion increase: From 20% in 2000 to 42% in 2022
- Number of differentiated formulations: average formula number of major enterprises increased from 12 in 2000 to 35 in 2022.
-
5.Upstream and Downstream Industry Chain Analysis
5.1 Upstream Raw Material Industry
5.1a Basic Raw Material Supply Status:
- Natural Gas:
- Global NPK production consumes approximately 110 million tons oil equivalent/year of natural gas, accounting for 8-10% of industrial gas usage
-
- Phosphate Rock:
- Global exploitable reserves approximately 70 billion tons, current extraction 240 million tons/year, Morocco accounts for 70% of reserves
-
- Potash Salt:
- Global exploitable reserves approximately 17 billion tons K₂O, annual production about 45 million tons, Canada, Russia, and Belarus control 80% of capacity
-
5.1b Raw Material Price Fluctuation Impact
- Natural gas price increase of 10% leads to nitrogen fertilizer cost increase of 6-8%
- Phosphate rock price increase of 10% leads to phosphate fertilizer cost increase of 4-6%
- Potash salt price increase of 10% leads to potash fertilizer cost increase of 7-9%
5.1c Raw Material Innovation and Substitution:
- Green ammonia technology: Using renewable energy for water electrolysis to produce hydrogen, then synthesizing ammonia, reducing carbon emissions by > 90%
- Low-grade phosphate rock utilization: New processes can utilize low-grade phosphate rock with P₂O₅ contentBiological potassium solubilization technology: Enhancing the effectiveness of insoluble potassium in soil through microorganisms, reducing dependence on potash fertilizer.
5.2 Midstream Production and Processing
5.2a Production Technology Comparison:
Technology Route Global Share Investment Cost (Million $/100,000 tons) Energy Consumption (kWh/ton) Water Consumption (ton/ton) Product Nutrient Content Tower Granulation 40% 45-60 40-60 0.1-0.3 40-52% Drum Granulation 25% 28-38 50-70 0.2-0.4 35-45% Disc Granulation 15% 25-35 55-75 0.3-0.5 35-45% BB Fertilizer Mixing 20% 8-15 10月20日 35-60% 5.2b Production Process Efficiency Indicators
- Raw material utilization rate: tower method 98.5%, drum method 96-97%, disc granulation 95-96%
- Energy efficiency: Tower method thermal energy utilization rate 70-75%, drum method 60-65%, disc granulation 55-60%
- Labor productivity: highly automated factories 0.2-0.3 persons/thousand tons capacity, semi-automated 0.5-0.8 persons/thousand tons capacity
5.2c Global Capacity Distribution and Utilization Rate
- Global NPK compound fertilizer total capacity approximately 250 million tons, capacity utilization rate 72%
- Main capacity distribution: Asia-Pacific 46%, Europe 23%, North America 16%, others 15%
- Regional differences in capacity utilization rate: North America 82%, Europe 79%, Asia-Pacific 69%, Latin America 65%
5.3 Downstream Application Market
5.3a Agricultural Application Field Proportion:
- Field crops: 55-60%, mainly used for food production
- Economic crops: 18-22%, including cotton, sugarcane, oil crops
- Fruit and vegetable cultivation: 12-15%, high-value horticultural crops
- Turf and ornamental plants: 5-8%, including golf courses, urban greening
- Other fields:3-5%, including forestry, aquaculture
5.3b Application Method Development Trends
- Precision fertilization technology application proportion: 10% in 2010, 32% in 2022, expected to reach 50% by 2030
- Fertigation penetration rate: facility agriculture increased from 15% in 2010 to 48% in 2022
- Mechanized fertilization proportion: developed countries > 95%, developing countries increased from 30% in 2010 to 55% in 2022
5.3c End User Structure
- Large farms (>100 hectares): Consumption proportion 38%, high cost sensitivity, emphasis on product stability
- Medium farms (10-100 hectares): Consumption proportion 32%, focus on product cost-effectiveness
- Small farms (: Consumption proportion 22%, high requirements for packaging specifications and usage convenience
- Specialty cultivation: Consumption proportion 8%, high requirements for product functionality and professionalism
-
-
-
-
More Sourcing News

444
April 3, 2025

417
April 3, 2025

370
April 22, 2025

350
April 22, 2025

333
April 22, 2025